Faili:European Output of Books 500–1800.png

Yaliyomo ya ukurasa hayatumiki katika lugha nyingine.
Ufafanuzi kutoka Wiktionary, kamusi iliyo huru

Faili halisi(piseli 1,436 × 953, saizi ya faili: 64 KB, aina ya MIME: image/png)

Faili hili linatoka Wikimedia Commons na huenda likawa limetumika na miradi mingine. Maelezo yaliyopo katika ukurasa wa maelezo ya faili linaonyeshwa hapa.

Muhtasari

Maelezo
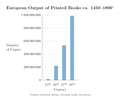
Deutsch: Geschätzte europäische Buchproduktion von 500 bis 1800. Bei den Manuskripten sind einzelne Urkunden und Chartas nicht berücksichtigt. Ein gedrucktes Buch ist definiert als ein Druckwerk von mehr als 49 Seiten.
English: Estimated European output of books from 500 to 1800. Manuscripts do not include individual deeds and charters. A printed book is defined as printed matter containing more than 49 pages.
Tarehe
Chanzo

Kazi yangu

Data from: Buringh, Eltjo; van Zanden, Jan Luiten: "Charting the “Rise of the West”: Manuscripts and Printed Books in Europe, A Long-Term Perspective from the Sixth through Eighteenth Centuries", The Journal of Economic History, Vol. 69, No. 2 (2009), pp. 409–445 (416–417, tables 1&2)
Mwandishi Tentotwo
Matoleo mengine
This graph image could be re-created using vector graphics as an SVG file. This has several advantages; see Commons:Media for cleanup for more information. If an SVG form of this image is available, please upload it and afterwards replace this template with {{vector version available|new image name}}.


It is recommended to name the SVG file “European Output of Books 500–1800.svg”—then the template Vector version available (or Vva) does not need the new image name parameter.

LaTeX source

\documentclass[border=5mm]{standalone}
\usepackage{pgfplots}
\usepackage[super]{nth}
\usepackage{amsmath}
 
 
\pgfplotstableread{
Siglos Manuscritos Libros impresos
6       13552           nan
7       10639           nan
8       43702           nan
9       201742  nan
10      135637  nan
11      212030  nan
12      768721  nan
13      1761951 nan
14      2746951 nan
%15   4999161 12589000
16       nan            217444000
17      nan             531941000
18      nan             983874000
}\datatable
 
\definecolor{RYB1}{RGB}{128, 177, 211}
\definecolor{RYB2}{RGB}{253, 180, 98}
 
\begin{document}
\begin{tikzpicture}
\begin{semilogyaxis}[
        axis on top=false, grid=both, xmajorgrids=false, every minor grid/.style=gray!20,
        axis lines*=left,
        width=12cm, height=8cm, enlarge x limits=0.05,
        ymin=1000, ymax=1e9,ytick={1000,1e4, 1e5, 1e6, 1e7, 1e8, 1e9},
        yticklabels={1000, 10\,000, 100\,000, 1\,000\,000, 10\,000\,000, 100\,000\,000, 1\,000\,000\,000},
        enlarge y limits=false,
        ybar=-10pt, xtick={6,...,18}, xticklabel={\pgfmathparse{int(\tick)}\nth{\pgfmathresult}},
        xlabel=Siglos, xlabel style={yshift=-1ex},ylabel=Número\\ de Copias,
        ylabel style={rotate=-90, align=left, anchor=east, xshift=-4ex, name=ylabel},
        after end axis/.code={
                \node [
                        font=\large\bfseries,
                        text=RYB2!60!black, fill=white, fill opacity=0.85, text opacity=1,
                        anchor=center, inner xsep=1pt]  at (axis cs:11,5e3) {Manuscritos};
                \node [
                        font=\large\bfseries, inner xsep=1pt,
                        text=RYB1!60!black,
                        fill=white, fill opacity=0.85, text opacity=1,
                        align=center, anchor=center]  at (axis cs:16.6,5e3) {Libros impresos};\
        },
        title={Producción Europea occidental de libros entre los años 500 y 1800$^{\text{\tiny{*}}}$},
        title style={font=\large\bfseries, align=center}
        ]
 
        \addplot +[fill=RYB1, draw=RYB1!50!black] table [y=Books] {\datatable};
        \addplot +[fill=RYB1, draw=RYB1!50!black, /pgf/bar shift=2.5pt] coordinates {(15,12589000)};
        \addplot +[fill=RYB2, draw=RYB2!50!black] table {\datatable};
        \addplot +[fill=RYB2, draw=RYB2!50!black, /pgf/bar shift=-2.5pt] coordinates {(15,4999161)};
        \draw (rel axis cs:0,0) -- (rel axis cs:1,0);                 
\end{semilogyaxis}
\node (annotation) at (current axis.below south west) [inner xsep=0pt, anchor=north west, align=left, font=\tiny] {$^*$without Southeast Europe (Byzantine, later Ottoman realm) and Russia};
 
\end{tikzpicture}
\end{document}

Hatimiliki

I, the copyright holder of this work, hereby publish it under the following license:
w:en:Creative Commons
sifa shiriki sawa
Uko huru:
  • kushiriki – kunakili na kusambaza kazi hiyo
  • kwa remix – kurekebisha kazi
Chini ya masharti yafuatayo:
  • sifa – Ni lazima utoe mkopo unaofaa, utoe kiungo cha leseni, na uonyeshe ikiwa mabadiliko yalifanywa. Unaweza kufanya hivyo kwa njia yoyote inayofaa, lakini si kwa njia yoyote inayopendekeza mtoa leseni akuidhinishe wewe au matumizi yako.
shiriki sawa – Ukichanganya, kubadilisha, au kujenga juu ya nyenzo, lazima usambaze michango yako chini ya same or compatible license kama ya awali.

Captions

Add a one-line explanation of what this file represents

Items portrayed in this file

depicts Kiingereza

copyright status Kiingereza

copyrighted Kiingereza

15 Desemba 2011

Historia ya faili

Bonyeza tarehe/saa kuona faili kama ilivyoonekana wakati huo.

Tarehe/SaaPicha ndogoVipimoMtumiajiMaelezo
sasa hivi02:41, 22 Desemba 2011Picha ndogo ya toleo la 02:41, 22 Desemba 20111,436 × 953 (64 KB)TentotwoRemoved source text from image
03:53, 16 Desemba 2011Picha ndogo ya toleo la 03:53, 16 Desemba 20111,455 × 953 (73 KB)TentotwoImproved formatting
00:38, 15 Desemba 2011Picha ndogo ya toleo la 00:38, 15 Desemba 20111,260 × 799 (87 KB)Tentotwo

Hakuna kurasa zozote zinazotumia faili hii.

Matumizi ya faili ulimwenguni

Wiki nyingine hutumia faili hizi: